
The Ezyfit toolbox for Matlab enables you to perform simple curve fitting of one-dimensional data using arbitrary (non linear) fitting functions.
|
EzyFit adds a new menu to your figure windows, which allows you to easily fit your data with predefined or user-defined fit equations, including selection of your data (outliers removing) using the ``Data Brushing'' tool. This toolbox also provides a set of command-line functions to perform curve fitting 'programmatically': you just have to type something like showfit('c+a/x^n') and EzyFit gives you the values for c, a and n and shows you the curve! Version 2.45 - 23 Jan 2017. Alternate download site here |
|
This toolbox is covered by the BSD License.
Copyright (c) 2005-2017, Frédéric Moisy. All rights reserved.
Why using EzyFit?
There are three ways to perform curve fitting with Matlab: the first one is using the 'Basic Fitting Interface' of Matlab, the second one is using fminsearch with an external function, and the third one is to pay for the Curve Fitting Toolbox. However, for usual curve fitting of 1D data, you may find the first solution rather limited (only polynomial fits), the second one a little complicated, and the third one quite expensive...
The EzyFit Toolbox provides a free, simple and efficient way to perform quick curve fitting with arbitrary (nonlinear) fitting functions. In the command-line mode, you just have to type something like showfit('c+a/x^n') and EzyFit gives you the values for c, a and n and shows you the curve! In the interactive mode, a new menu is added to your figure window to easily fit your data with predefined or user-defined fits.
System requirements
Ezyfit works with MATLAB 7 (R2006a) or higher, on every operating system (successfully tested up to Matlab R2016b, under Windows 7, 8 and 10). The command-line functions (e.g. ezfit, showfit...) work equally well on all systems. However some graphical operations may not be fully stable, especially on non-Windows systems.
Installation
1. Download and unzip the EzyFit Toolbox in a directory somewhere in your system. For instance, in a Windows installation, the directory Documents/MATLAB/ezyfit may be a good location. Do NOT install the toolbox directly in the directory of the Matlab application (Program Files/Matlab directory in Windows). If you upgrade from an older version, first empty the previous directory.
2. Select 'Set Path' (available in the menu File in Matlab 7, or in the tab Home in Matlab 8). In the dialog box, click on 'Add Folder' (NOT 'with subfolders') and select the ezyfit directory. Click on 'Save' and 'Close'.
3. If you want to always have the Ezyfit menu in your figures, type efmenu install. This will create or update your 'startup.m' file in the main user directory of your Matlab installation.
Note: If you upgrade Matlab and you want to use your previous Ezyfit installation, you just have to follow the steps 2-3.
Getting started
First step: curve fitting from the EzyFit menu
First plot some sample data by typing plotsample. In the EzyFit menu of the figure window (see figure below), select Show Fit and choose an appropriate fitting function to fit the sample data. You may use the ``Data Brushing'' tool (available since Matlab 7.6 only) to fit only part of your data.
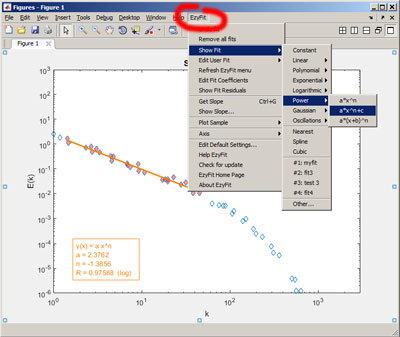
Choose Undo Fit if you want to remove the fit.
If multiple curves are present in the figure, first select the one you want to fit, and then choose Show Fit.
Two additional items, Get Slope and Show Slope, allows you to make a quick linear fit "by eye" of your data. Drag a line through your points (use the menu Insert > Line), and Get Slope gives you the equation of the line (works in linear/logarithmic scales).
Second step: curve fitting from the command window
Although fitting your data from the EzyFit menu is fast and easy, using the command-line functions is much more powerful.
The key function of the toolbox is ezfit, which computes the coefficients that fit the data. The function showfit simply calls the function ezfit for the active curve and displays the result. Type undofit to remove the last fit.
This example fits some noisy data by a power law c * x^n and plots the result:
plotsample power           % a power law
showfit c*x^n
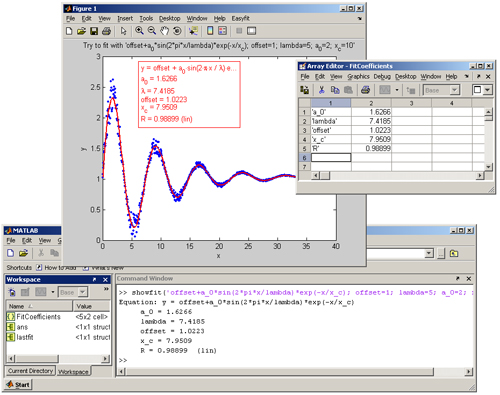
This example fits an histogram with a Gaussian, and displays the coefficients in the Array Editor:
plotsample hist           % an histogram
f = ezfit('gauss');       % fits with a Gaussian
f                         % displays the fit structure
showfit(f);               % displays the fit
editcoeff(f);             % opens the Array Editor
More examples?
Have a look to the Sample session for more examples.
See also the Frequently Asked Questions section and the Function by category section to learn more about this toolbox.
Earlier versions
ezyfit2.44.zip (2016/05/23)
ezyfit2.43.zip (2014/10/25)
ezyfit2.42.zip (2014/03/25)
ezyfit2.41.zip (2012/07/08)
Older versions
Links
EzyFit page on the Matlab Central.
This page is hosted by FAST
Last update: Jan 23, 2017.