Well, the "Basic Fitting" looks nice, but it only fits polynomials!
MathWorks' "Curve Fitting Toolbox" does much more than EzyFit. But EzyFit is simpler (you can make it work in 1 minute), and it is free. For most usual problems, EzyFit will surely do the job.
First select the curve you want to fit using the pointer (mouse), and then fit it.
Type efmenu to have the EzyFit menu in your current and all subsequent figures. You may also type
to have the EzyFit menu by default in all your figures (this will automatically run efmenu at each Matlab restart).efmenu install
Yes, the fit properties and display settings (color, width, equation box...) can be changed by specifying directly some 'PropertyName/PropertyValue' pairs, when calling showfit, e.g.
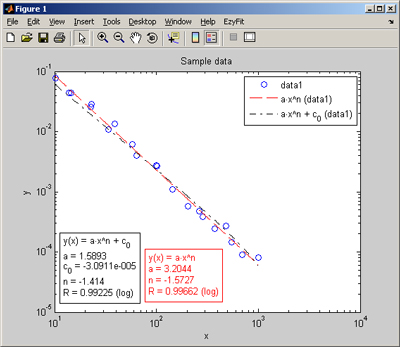
plotsample power
showfit('a*x^n; n=-1','fitcolor','red','fitlinestyle','--');
showfit('a*x^n+c_0; n=-1','fitcolor','black','fitlinestyle','-.');
legend show
You may also change the default settings, which are coded in the M-file fitparam.m (click here to open the M-file and follow the instructions).
If you have Matlab >= 7.6, use the "Data Brushing" tool to select the points you want to fit, and then call ezfit or showfit.
If your data are X,Y, you just obtain the fitted parameters by
See this question to see how to get the fitted values from f.f = ezfit(x,y,'a*ln(x/c)+k');
See the options fp.fitcolor, fp.fitlinestyle and fp.fitlinewidth in fitparam.
For nonlinear fits, you should provide initial guesses for the parameters of your fits to "help" the solver to converge towards the "good" values. The solver (the fminsearch function) starts from the initial guesses and then varies the coefficients in an attempt to find the best fit.
For example, suppose you have the data
which you want to fit with an exponential decay,x=1:10; y=[15 14.2 13.6 13.2 12.9 12.7 12.5 12.4 12.4 12.2]; plot(x,y,'*')
showfit('cste+a0*exp(-x/L)');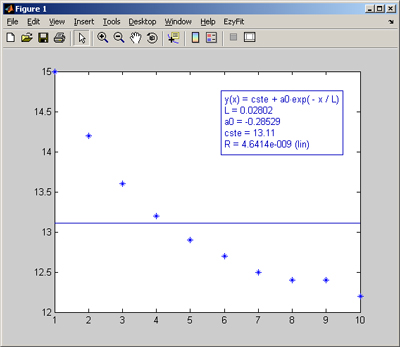
showfit('cste+a0*exp(-x/L); cste=10');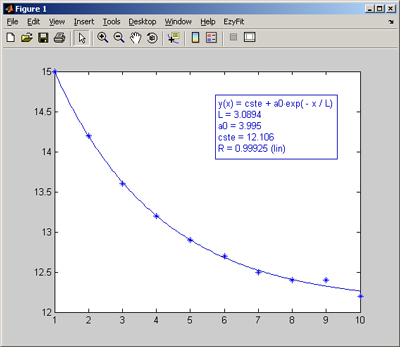
You may also specify the initial guesses like this:
showfit('cste+a0*exp(-x/L)',[10 1 1]);It indicates whether the data itself, say Y, or its logarithm, LOG(Y), has been fitted. By default the mean square procedure is applied to Y if the Y-axis of the current figure is linear, and it is applied LOG(Y) if the Y-axis is logarithmic. For instance, plot a power law in log scales,
If you tryplotsample power
showfit('power')You may also force ezfit to fit Y or LOG(Y) whatever the Y-axis, by specifying the optional argument
showfit('power;log','fitcolor','blue');
showfit('power;lin','fitcolor','red');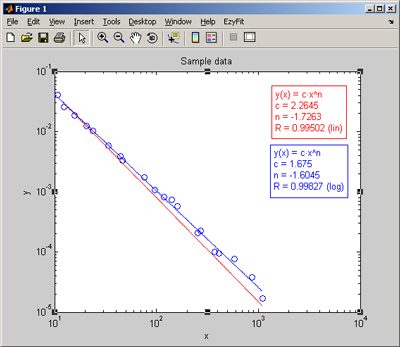
Yes, see the option fp.extrapol in fitparam.
Fit your data using
f = ezfit('a*x+b');You may also directly create in the current workspace a set of variables which contain the values of the fitted parameters:
This will create two variables, 'a' and 'b'. You can also set the option 'automakevarfit = on' in fitparam: This will call makevarfit each time ezfit (or showfit) is executed.makevarfit(f);
Yes. First, you may define your favorite fit equation as a user-defined fit, by typing
This will update the file 'userfit.mat' in the EzyFit directory, so your fit equation may be re-used in a future session. You can now fit your data using this user-defined fit,editfit(3,'myspectrum','E(k) = C*k^(-n); C=0.1; n=2; log');
showfit('myspectrum');and to save it in a Mat-file,myfit = 'E(k) = C*k^(-n); C=0.1; n=2; log';
save('myfits.mat','myfit');showfit(myfit);
Yes. The default settings (color, width, equation box etc.) are coded in the file fitparam.m. So you may create a copy of this file with your own settings, and you just have to rename the settings file you want to use fitparam.m.
The core function of the EzyFit toolbox is ezfit, which is based on Matlab's built-in FMINSEARCH function (Nelder-Mead method). FMINSEARCH performs an unconstrained nonlinear minimization of the SSR (sum of squared residuals) with respect to the various parameters. The additional function showfit simply calls ezfit with graphical output.
This error means that FMINSEARCH could not converge towards a solution in a reasonable number of iterations. There is no way for the moment to change this number of iterations in EzyFit. Try to use initial guesses closer to the expected values.
See the uninstallation procedure here.
If the Ezyfit toolbox has been installed using efmenu, all saved figures (.fig files) and GUIs created using GUIDE have the Ezyfit menu included (sometimes several occurence of the Ezyfit menu). If you try to open the figure or GUI under a Matlab system without the Ezyfit toolbox, the error ??? Error using ==> struct2handle Undefined function or variable 'efmenu' is issued. Use the function remove_efmenu_fig (introduced in Version 2.40) in order to remove the menu. If you want to uninstall the Ezyfit toolbox, or only the Ezyfit menus, see here.