Spiral
patterns in swirling flows
Frédéric
Moisy, Thomas Pasutto, Georges Gauthier, Philippe Gondret and Marc Rabaud
FAST, Bat. 502, 91405
Orsay Cedex, France
PDF Version (300 Ko)
Spiral
galaxies, atmospheric or oceanic circulation, bathtub vortices, or even
stirring tea in a cup, are examples that illustrate the ubiquity of swirling
flows at all scales in nature. They are not only fascinating, but also
of great importance in a number of industrial or practical applications.
Earth rotation provides
the most spectacular illustrations of rotating flows. At the end of the
XIXth century, during the earlier polar expeditions, the Norwegian oceanographer
Nansen noticed that the iceberg drift was not along the wind direction,
as expected, but rather towards the right [1]. The Swedish physicist Walfrid
Ekman, who saw the influence of the Coriolis force in this problem, gave
an explanation for this phenomenon in 1905. For an observer in the Earth
frame, a linear motion will appear as curved, with a deviation to the right
in the Northern Hemisphere. Likewise, the upper layers of water, over a
depth of about one hundred meters, are dragged by the wind with a deviation
towards the right [2]. The large oceanic motions originate from this phenomenon,
and the same goes for the iceberg trajectories!
Let us consider a
simple experiment, perhaps closer to our daily life. You have surely noticed
that, when stirring tea, the tea leaves or other small solid particles
heavier than water were collecting towards the centre of the bottom of
the cup. Perhaps you would have expected the centrifugal force to expel
them outwards! The friction at the bottom of the cup actually explains
this seeming paradox. The centrifugal force, which varies as the square
of the velocity, is weaker at the bottom, giving rise to a recirculation
flow (see Figure 1). This inward recirculation is usually
called the Bödewadt layer (1940), after the German fluid mechanician
who described the motion of a rotating fluid over an infinite wall at rest.
However, Albert Einstein was the first to give an explanation of this phenomenon
in 1926 in the case of the teacup! [3] (It is said that, with this explanation,
Einstein appeased Mrs. Schrödinger's curiosity, which her husband
could not satisfy).


Fig.
1: (a) Original Figure by Einstein (1926), from his paper about
the formation of meanders in the courses of rivers [3]. The rotation of
the fluid is slowed down close to the bottom of the teacup, on a boundary
layer of thickness d.
(b) The centrifugal force in this layer is then much lower than in the
rest of the fluid, giving rise to a recirculation flow which brings together
the tea leaves in the centre of the cup.
The region of fluid
slowed down by the wall friction is called a boundary layer, and plays
a key role in fluid mechanics. Its thickness, d,
is given by the lengthscale where the imposed rotation W
is diffused by viscosity in the intermediate fluid layers. In the ideal
case of a fluid rotating over an infinite wall, the balance between centrifugal
and viscous forces yields d
~ (n/W)1/2
(where n is the kinematic viscosity of the fluid), which is a constant,
independent of the radius r. Such a situation is said to be self-similar,
i.e. the velocity profile remains unchanged when distances are rescaled.
According to each situation, W may be the fluid velocity, the wall velocity
or the relative velocity between the two. Within this self-similar description,
since d is the only lengthscale of the problem, all the physical phenomena
are expected to take place on a scale of order d.
On the other hand,
when the wall or the fluid extent is not infinite, other length scales,
such as the teacup radius or the tea depth, may play a role too, and self-similar
solutions are no longer of any help. Let us consider for simplicity the
situation where the fluid is confined between two rotating disks ˇ the
upper one may be the free surface of the tea. In the general case, two
boundary layers may be present, a centrifugal one over the faster disk
and a centripetal one over the slower disk. Actually, the equations of
motion without the self-similar hypothesis are so complex that no exact
solution are known for this simple problem, even in the stationary regime.
This problem gave rise to a famous controversy in the history of fluid
mechanics: George Batchelor (1951) argued that two boundary layers, separated
by a solid body rotation core, must take place in the fluid, whereas Keith
Stewartson (1953) claimed that only one boundary layer should be present
[4]. It has actually been shown, many years later, that a large variety
of solutions may coexist in this flow, including the ones of Batchelor
and Stewartson.
The stability of rotating
flows is of considerable practical interest. Hard-disk drives are an important
example: the instabilities of the thin air layer over the rapidly rotating
platters induce vibrations of the read/write heads, that may damage the
platters' surface [5]. The general problem of the stability of rotating
flows is very complex, mainly because of two antagonistic effects: On the
one hand, rotation tends to stabilise the flow, by inhibiting the perturbations
about the rotation axis, eventually leading to a two-dimensional state.
On the other hand, the confinement generates differential rotation (basically
because of the wall friction), leading to centrifugal forces imbalance
and possible instabilities. In this context, there is no hope to obtain
exact solutions, and only experiments or numerical simulations are able
to shed light on the physical mechanisms responsible for the instabilities
in rotating flows.
A rotating disks experiment
In order to study
the instabilities of the flow between two rotating disks, the experimental
set-up shown in Figure 2 has been built [6-8]. It consists
of two coaxial disks, each of radius R=14 cm and separated by a
distance h, which can be varied between a few mm up to several cm.
The upper disk is the cover of a cylindrical rotating tank filled with
a solution of water and glycerine, in which the lower disk can rotate independently.
The upper disk is transparent, allowing us to visualise the flow from above.
Small anisotropic flakes are seeding the working fluid, and their orientation
with the velocity field leads to variations of the reflected light. For
instance, the bright regions in the following pictures correspond to mainly
horizontal flakes, whereas dark regions are associated with mainly vertical
flakes.
Each disk rotates
with its own angular velocity, Wt
and Wb.
We call co-rotation the situation where both disks rotate in the same direction
(Wt
and Wb
are of the same sign); the instabilities of this flow are first described.
The much richer patterns arising in the counter-rotating flow, when the
two disks rotate in opposite direction, are analysed in a second part.

Fig.
2: Experimental set-up. The top disk is transparent,
in order to allow visualisation from above. It rotates together with the
cylindrical endwall (blue). The bottom disk (orange) is distant from
the top disk by a few mm up to several cm. In this picture, the bottom
disk has been lowered for visibility.
Boundary layer instabilities
Let us first consider
the flow when only one disk, the upper one, rotates: this is the rotor-stator
configuration (Wt
<> 0 and Wb
= 0). When slowly increasing the disk velocity from 0, nothing appears:
the light reflected by the flakes remains homogeneous. The flow may be
seen as doubly symmetric: it is invariant with respect to any rotation
(axisymmetric) as well as any time translation (stationary). Above a given
disk velocity, a first instability pattern appears in the form of annular
vortices, simply called circles, propagating towards the centre of the
cell, as shown in Figure 3a. In this case, the temporal
symmetry is broken, but the axisymmetry remains. If the angular velocity
is further increased, another instability appears in the form of a spiral
pattern. The axisymmetry of the flow is now broken too. This second pattern
received the name of positive spirals, because they roll up to the centre
in the direction of the rotating disk.
A careful inspection
of the Figure 3a allows us to understand the nature
of the instability that gives rise to these patterns. One can see the spiral
arms do not extend over the whole flow, but rather stop at a well-defined
radial location, where the boundary layers of each disk merge. In other
words, for r > r0, where the positive spirals
can be seen, the boundary layers are separated, whereas for r <
r0
the viscous effects dominate the flow over the whole gap and no boundary
layer can be defined. This observation suggests that positive spirals only
exist within the boundary layers, and that they are the result of boundary
layer instability. Additional observations, by means of visualisations
in the vertical plane normal to the disks, confirm this assumption.
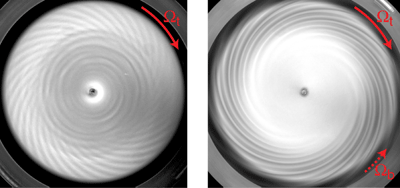
Fig.
3: (a) Circles and positive spirals in the rotor-stator regime.
These patterns result from boundary layer instabilities. (b) Negative spirals
in the counter-rotation regime. This pattern originates from a shear layer
instability.
What happens now if
the lower disk rotates too? From the frame rotating with the lower disk,
this situation is similar to the one where only the upper disk rotates
with a relative angular velocity *W
= Wt
- Wb.
As a consequence, the instability threshold should just get shifted upwards,
of a quantity Wb.
Unfortunately, this picture is rather naive: the dynamics in a rotating
frame is very different from that in the laboratory frame. In order to
take into account the non-Galilean nature of the rotating frame, one should
consider the effect of the Coriolis force on the instabilities.
We show in Figure
4 a diagram that summarizes our observations when both disks are rotating.
The vertical and horizontal axes correspond to the angular velocities of
the bottom and top disks. By convention, Wt
is always positive, while Wb
may be positive in the co-rotation case (right part of the diagram) or
negative in the counter-rotation case (left part). The two dashed lines
correspond to equal velocities: Wt
= Wb
(solid body rotation) and Wt
= - Wb
(exact counter-rotation). The vertical line, Wb
= 0, corresponds to the rotor-stator case previously described.
As expected, the co-rotation
of the lower disk shifts upwards the instability thresholds: the borderlines
that delimit the circle pattern (yellow region) and the positive spirals
pattern (pink region) have a positive slope. However, these slopes are
different, which can be interpreted in terms of symmetry. The borderline
of the circle pattern appears to be parallel to the solid body rotation
line, Wt
= Wb,
indicating that the angular velocity difference *W
= Wt
- Wb
is the only control parameter for this instability, and no influence of
the global rotation occurs. In other words, the instability responsible
for the circle pattern, which does not break the axisymmetry, is not affected
by the additional rotation of the frame, i.e., by the Coriolis force. By
contrast, the borderline for the positive spirals, which are responsible
for the axisymmetry breaking, has a larger slope than the solid body rotation
line: in this case, the relative angular velocity *W
= Wt
- Wb
is not the only control parameter, and an extra velocity of the upper disk
is needed for the positive spirals to arise. The global rotation has now
the expected stabilising effect mentioned in the introduction.
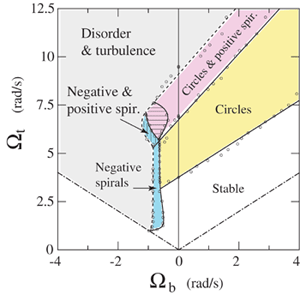
Fig.
4: Regime diagram of the different instability patterns
in the small gap case (h=7 mm). The right part (Wb>0)
corresponds to the co-rotation case, and the left part (Wb<0)
to the counter-rotation case [7].
Shear flow instability
So far we have restricted
our attention to the co-rotative (Wb
> 0) and weakly counter-rotating (about Wb
> - 0,5 rad/s for this gap) regimes. The observed phenomena are rather
different if we now focus on a more intense counter-rotating regime, where
a new instability pattern arises, as shown in Figure 3b.
Here again we observe a spiral pattern, but it is by far very different
from the boundary layer instability patterns described up to now. First,
the spiral arms roll up the centre in the direction opposite to the faster
disk: for this reason we call them negative spirals (blue region in the
diagram of Figure 4).
Perhaps the most striking
characteristics of the negative spirals is their very large growth time:
when the onset is carefully approached from below, about 10 to 20 minutes
are required for the negative spirals to arise. Such very slow dynamics
strongly contrasts with the circles and positive spirals, which appear
almost instantaneously when their threshold is reached. For this reason,
a precise determination of the negative spirals threshold is a rather delicate
work, that needs a very stable and controlled apparatus andÍ a lot a patience!
Slightly further from the threshold, this growth time takes more reasonable
values, of the order of one minute or a few seconds. Actually, it can be
shown that this growth time diverges as one approaches the onset, a usual
property for critical systems near a bifurcation point.
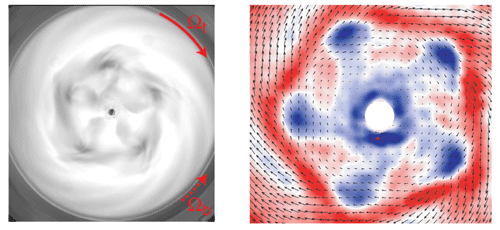
Fig.
5: (a) Example of a 5-armed negative spiral pattern, observed
for a large gap thickness (h=20 mm). This picture has to be compared to
the equivalent pattern for a small gap, in Figure 3b.
(b) Corresponding velocity field, as measured from Particle Image Velocimetry
(PIV). Colors are coding the levels of vertical vorticity, i.e., the 2D
local rotation rate of fluid particles [8].
What happens now if
the gap between the disks is changed? We can see that the morphology of
the negative spirals strongly differs, from h=7 mm (Figure
3b) to h=20 mm (Figure 5a). For this new
gap, the instability gives rise to a more complex structure near the centre
of the cell, in the form of a circular chain of vortices surrounded by
spiral arms. Moreover, the number of spiral arms is smaller in the large
gap case: from 11 arms for the small gap, down to 5 arms in the large
gap case (values down to 2 arms can be found for even higher values of
h). This variation can be easily understood, if we imagine the spiral arms
as vortex tubes, whose diameter is of order of the gap thickness h.
More insight into
the physical mechanism responsible for the formation of this pattern may
be obtained from the velocity field of the bifurcated flow. In the case
of the large gap, this velocity field can be obtained by means of Particle
Image Velocimetry (PIV). This non-invasive technique consists in measuring
the distance swept by small particles seeding the flow between two successive
images. The particles are illuminated by a pulsed laser sheet synchronised
with a high-resolution video camera. In Figure 5b,
obtained for the same angular velocities as in Figure 5a,
we can see the circular chain of 5 vortices surrounded by the negative
spiral arms, similar to the pattern visualised using the flakes [8]. The
colours encode the levels of vorticity, i.e., of local rotation rate of
the fluid particles, from blue (counter-clockwise) to red (clockwise).
An important feature
of this velocity field is the presence of an intense shear layer (in red),
where strong vorticity is concentrated. This thin layer separates the outer
part, rotating with the faster (upper) disk, from the inner part, where
much lower velocities are found. The origin of this shear layer can be
understood from the Figure 6. In the counter-rotating
regime, each disk tends to impose its rotation to the fluid (full arrows),
associated with a centrifugal flow (dashed arrows). The centrifugal
flow induced by the faster disk, in red, recirculates towards the centre
of the slower disk due to the lateral end wall. This inward recirculation
flow meets the outward radial flow induced by the slower (bottom) disk,
in green, leading to the formation of two recirculation cells. At the interface
between these two cells a strong shear layer takes place. Such layer is
prone to an instability, which leads to an azimuthal modulation and to
the roll-up into individual co-rotating vortices [9]. This instability
mechanism was first introduced in the simpler case of a linear shear layer
by Lord Kelvin and Hermann von Helmholtz at the end of the XIXth century,
and was aiming to explain the wave formation due to the wind stress on
the sea surface [2].
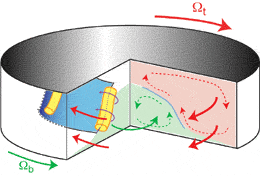
Fig.
6: Schematic view of the shear layer instability between
counter-rotating disks. Each disk tends to impose a centrifugal recirculation,
dividing the bulk of the flow into two recirculation cells (red and green).
At the interface between these two cells a shear layer takes place (in
blue), that becomes unstable and generates nearly vertical co-rotating
vortices (yellow).
Our flow between rotating
disks, although very simple, presents two classes of instability patterns,
associated with very different physical mechanisms: boundary layer instabilities
(circles and positive spirals), which have been studied for a long time
in similar flow geometries, and shear layer instability (negative spirals),
which have been first observed in our particular set-up between counter-rotating
disks. The complexity of the observed phenomena is striking compared to
the apparent simplicity of the flow geometry. This is a generic situation
for systems governed by non-linear equations, among which the hydrodynamics
systems play a central role. The basic solutions, usually simple because
associated with a high degree of symmetry, are replaced by much richer
patterns, that may coexist and interact together (see the dashed regions
in Figure 4). The flow between two coaxial cylinders,
of practical importance in rheology, is another example of very simple
flow with a large variety of instability patterns and transitions towards
turbulence.
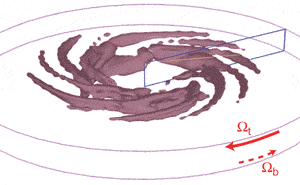
Fig.
7: Numerical simulation of the flow between counter-rotating
disks. Negative spirals with 9 spiral arms can be seen. Data from O. Daube
and P. Le Quéré [10].
The new class of instability
revealed in our experiment has motivated a numerical study of the flow
between counter-rotating disks. Such simulations are very expensive in
terms of computational time: because of the very large growth times, the
full 3D Navier-Stokes equations have to be simulated over a very long time.
This work has been carried out by Olivier Daube, of laboratory CEMIF (Evry,
France), and Patrick Le Quéré, of laboratory LIMSI (Orsay,
France). Figure 7 is a visualization of the flow between
counter-rotating disks separated by the distance h=20 mm, where
the surfaces of iso-vertical velocity are shown [10]. This quantity traces
the rolling up of the streamlines in the radial and azimuthal directions,
and clearly exhibits a spiral pattern in excellent agreement with the ones
observed experimentally.
Such heavy computations
are now feasible thanks to new generation of supercomputers, and opens
new and exciting perspectives in the understanding of complex flow phenomena.
Among the situations of considerable practical interest are the turbomachines
used in power plants or aeronautics engineering. This latter application
involves huge rotations rates (more than 10 000 rpm), and accurate modelling
of the turbulent phenomena present at small scales are clearly needed for
such numerical simulations. In this context, the excellent recent agreements
between experiments and numerical simulations are encouraging for the understanding
and modelling of turbulence under strong rotation.
This article is
based on an original version published in Bulletin de la SFP (French Physical
Society), 135, p.4, July 2002.
References
Electronic address:
moisy@fast.u-psud.fr
[1] http://www.nrsc.no/nansen/fritjof_nansen.html
[2] E. Guyon, J.P.
Hulin, L. Petit and C. D. Mitescu, Physical hydrodynamics (Oxford University
Press, 2001).
[3] A. Einstein, Die
Naturwissenschaften 26, 223 (1926). A translation can be found in
Ideas and Opinions (Bonanza Books, New York, 1954), pp. 249-253.
[4] G.K. Batchelor,
Q. J. Mech. Appl. Maths 4, 29 (1951). K. Stewartson, Proc. Camb.
Phil. Soc. 49, 333 (1953).
[5] J.A.C. Humphrey,
C.J. Chang, H. Li and C.A. Schuler, Adv. Inf. Storage Syst. 1, 79
(1991).
[6] G. Gauthier, P.
Gondret and M. Rabaud, J. Fluid Mech. 386, 105 (1999).
[7] G. Gauthier, P.
Gondret, F. Moisy and M. Rabaud, J. Fluid Mech. 473, 1 (2002). See
also Phys. Fluids 14, S7 (2002), and the Gallery of Fluid Motion
http://ojps.aip.org/phf/gallery/index1.jsp
[8] F. Moisy, T. Pasutto
and M. Rabaud, Nonlinear Processes in Geophysics 10, 1 (2003).
[9] J.M. Lopez, J.E.
Hart, F. Marques, S. Kittelman and J. Shen, J.Fluid Mech. 462,
383 (2002)
[10] O. Daube, P.
Le Queré, F. Moisy and M. Rabaud, Proceeding 2nd International Conference
on Computational Fluid Dynamics (2002).
|


